A
property-plane is a 2D representation of property. It
can be displayed as contours, color-plane, and contours +
color-plane on a selected parallelepipedal region. In
XCrySDen these plots can be achieved
in two ways: (i) by calculating a property on parallelepipedal 2D
region, or (ii) as an option when a property was calculated in a 3D
cell region. Both ways are quite similar, but the second way is a
bit more advanced as it support an animation of property-planes
trough 3D region (all slices are displayed sequentially as
animation).
When we are dealing with 2D grids the window, where the
property-planes parameters can be set, looks like:
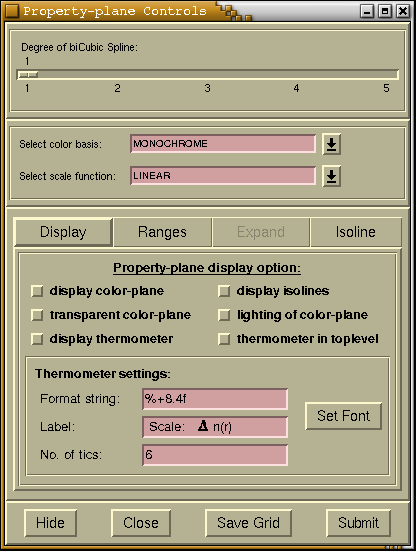
For the description of bi-cubic spline interpolation see the
discussion about
tri-cubic
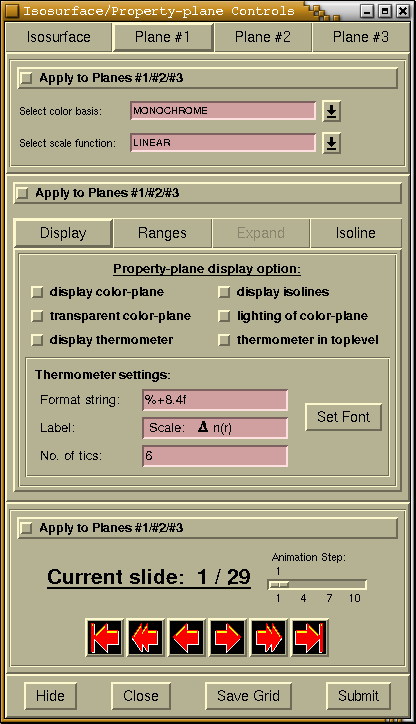
spline. All the rest is explained below. When we are dealing
with 3D grids the property-planes parameters can be set on several
different pages of
Isosurface/Property-plane
Controls window. This property-plane controlling window is
shown below.
Important: as there are many items on the below
window, the figure was made interactive in order to facilitate
easier explanation of items functions. Simply mouse-click
appropriate item (widget) to get its explanation.
!!! This figure is
interactive !!!
Forces the current setting of all parameters inside the frame to
apply to planes #1, #2, and #3. For each frame there is its own
Apply to Planes #1/#2/#3 checkbutton.
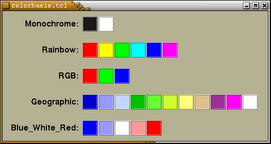
Here one can selects various color basis for the color-plane. The
following color basis are available:
- monochrome:
- the color-plane is rendered in black&white fashion
(dark=low values; bright=high values)
- rainbow:
- the color-plane is rendered in rainbow fashion (red=low values;
purple=high values)
- RGB:
- the color-plane is rendered in Red/Green/Blue fashion (red=low
values; blue=high values)
- geographic:
- the color-plane is rendered like the geographic map (i.e. see
in blue, low-altitude regions in green, hilly regions in brown and
mountains in pink&white).
- blue-white-red:
- the color is rendered in Blue-White-Red fashion (blue=low
values, red=high values). This color-basis is very suitable for
charge density difference plots.
Here you can see the colors of these color basis. The colors on the
left represents low values, while the colors on the right represent
the high values.
Here one can selects various scale functions for the
property-planes. One can chose among: linear, logarithmic,
square-root, cubic-root, exponential and Gaussian. For example for
charge density plots the logarithmic scale is usually more
appropriate as linear, whereas for charge density difference maps
the linear scale is usually better.
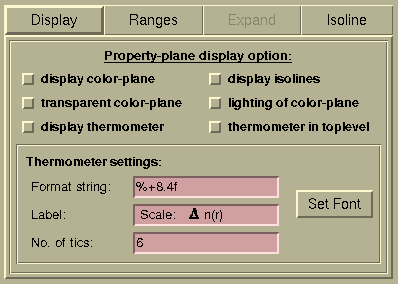
The
Property-plane display options are available in this
page. The checkbuttons have the following meaning:
- [display color plane]
- renders the property as color-plane
- [display isolines]
- renders the property as contours
- [transparent color plane]
- makes the colorplane to appear transparent
- [lighting of color-plane]
- when selected, the colorplane will undergo the lighting, which
means that its light-illumination (i.e. how bright it appears) will
depend on its orientation, while if lighting is disabled then
colorplane will show the same brightness regardless of it
orientation.
- [display thermometer]
- will display the scale-legend ("thermometer") for the
colorplane plot. The thermometer can be configured by widgets on
the Thermometer settings frame.
- [thermometer in toplevel]
- will display thermometer in separate toplevel window, and looks
like shown below. Press the [Print Thermo] button to print
the thermometer.
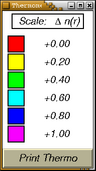
BEWARE: in order to print the thermometer it must be
displayed in toplevel window. The thermometer that is displayed on
the main-display window cannot be printed !!!
The meaning of the entries in the
Thermometer settings frame is the following:
- Format string: [ ]
- the format of the numbers displayed in the thermometer is set
here. The format syntax is the same as for C printf/scanf
function.
- Label: [ ]
- sets the label of the thermometer
- Number of tics: [ ]
- sets the number of tics to be displayed in the thermometer
And finally, the font used in the thermometer can be set by
pressing the
[Set Font] button.
IMPORTANT NOTE: press
the
[Submit] button to update new
setting.
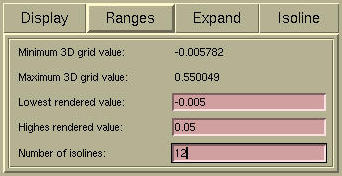
Here one can set the range for the plot, namely, lower and upper
bound, and the number of the isolines.
Warning: press the
[Submit]
button to update new setting.
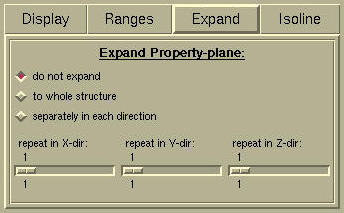
The radiobuttons and scales on this tab only appears for periodic
structures. The widgets allows to control the display of the
periodic replicas of the property-plane. I hope these widgets are
self-explanatory and we can try them out by testing.
Warning:
- press the [Submit] button to
update new expand setting.
- The isosurface can be expanded just to the size of the
currently displayed structure. Hence use the Modify-->Number of units drawn menu to
change the number of displayed unit cells.
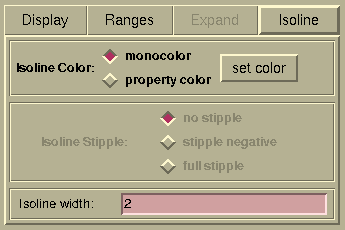
Here you can select the color theme of the contours. Contours can
be either rendered in one color (chose the color by
[set
color] button) or as
property color. This means the
each contour will be colored according to the chosen color basis
and its value. The width of the contour lines can be set in
Isoline width: [ ] entry.
The animation frame appears only if the grid is a 3D one. Then we
have a possibility of animating property-planes through the third
dimension.
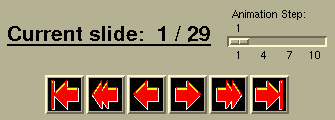
This label displays the sequential number of the currently
displayed property-plane among all available property planes.
Sets the animation step. For example the animation step=2 will
display the 1st, 3rd, 5th, 7th, ... slide.
I hope this buttons are self-explanatory. Their meaning is (going
from left to the right):
to the first, animate backward, one
step back, one step forward, animate forward, and
to the
last.
At the bottom of
Isosurface/Property-plane
Controls the
[Hide]/
[Close]/
[Save Grid]/
[Submit]
buttons are located. The function of these buttons is as follows:
| [Hide] |
Hides the Isosurface/Property-plane
Controls window. Hiding means that window is iconified, i.e.
the window disappears and its icon appears on XCrySDen main render window.
Pressing the icon deiconify the window
|
| [Close] |
Closes the window. The grid data will be
flushed (cleared).
|
| [Save Grid] |
Saves the grid data in XSF format.
|
| [Submit] |
Loads new isosurface parameters and renders an
updated isosurface.
|

![[Figure]](img/xcrysden-picture-small-new.jpg)