XCrySDen only visualizes
Fermi surfaces. This means it is user responsibility to calculate
eigenvalues in the irreducible wedge of Brillouin zone (IBZ). These
IBZ eigenvalues should then be generated over the whole BZ, and
stored in proper format, which is called Band XSF (BXSF). The BXSF
file can contain the eigenvalues of an arbitrary number of bands.
Here you can find all the details about
the BXSF format. Once the BXSF file is constructed load it as
xcrysden --bxsf file.bxsf or use the
File-->Open Structure ...-->Open
BXSF (i.e. Fermi surface files) . In a while the
Fermi surface will be displayed in a viewer window. Actually, the
viewer is composed from notebook, holding the corresponding Fermi
surfaces of particular bands in separate pages.
Note for WIEN
users: XCrySDen can
automatically calculate the eigenvalues using the WIEN program, and
generate the BXSF file. Please find more informations
here.
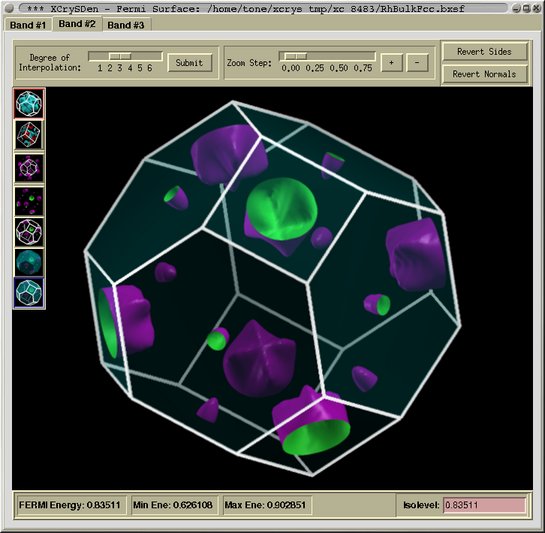
Fermi surface viewer is composed from several pages, each holding a
Fermi surface of particular band. In bellow figure, we see three
tabs (i.e. Band #1, Band #2, and Band #3) aimed at switching
between different pages. At the top of each page a top-toolbox is
located. The left-toolbox is located on the left side, while on the
bottom we have a status frame.
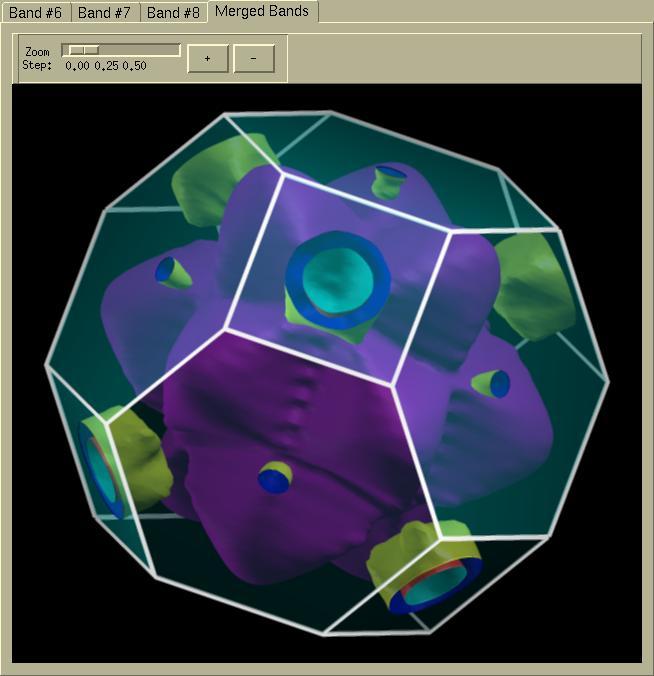
From the version 1.4 on the
XCrySDen can display the
Fermi surfaces of all the bands together (i.e. multi-band display
of Fermi surface). This option is accessed on the last (right-most)
page.
- Degree of Interpolation
The degree of
interpolation can be set with the scale-widget. Press the
[Submit] for performing the interpolation (it takes some
time). The interpolation is the so-called LCASI interpolation,
which gives superior results to spline interpolation, since it
quenches the oscillations. Use this feature to improve the quality
of surfaces.
- Zoom step
The zoom-step can be set with scale-widget. Pressing [+]
button enlarges Fermi surface, while the [-] button shrinks
the Fermi surface by zoom-step amount.
- Revert Sides
Reverts the front and back sides of the surface, i.e., front-side
becomes back-side and vice-versa.
- Revert Normals
Use this button when the illumination of the Fermi surface is
odd.
Here you can read more details
about the
Revert Sides/Revert Normals issues.
There are seven buttons located on the left-toolbox. Their function
is the following:
 -- displays Fermi surface in Brillouin zone (BZ)
 -- displays Fermi surface in reciprocal
unit cell
-- displays Fermi surface in reciprocal
unit cell
 -- toggles the cropping of Fermi surface to BZ
 -- toggles the display of the BZ and
reciprocal unit cell frames
-- toggles the display of the BZ and
reciprocal unit cell frames
 -- displays the BZ and reciprocal unit cell in wireframe mode
 --
displays the BZ and reciprocal unit cell in transparent-solid
mode
--
displays the BZ and reciprocal unit cell in transparent-solid
mode
 -- displays the BZ and reciprocal unit cell in
transparent-solid + wireframe mode
-- displays the BZ and reciprocal unit cell in
transparent-solid + wireframe mode
Status frame is located on the bottom of each page. On the left
side of the status frame the following informations are displayed:
Fermi energy, minimum eigenvalue of the current band, and maximum
eigenvalue of the current band. On the right side of the status
frame the
Isolevel: [ ] entry is located where one can set
the isovalue of the isosurface to display (hence can be different
from Fermi level).
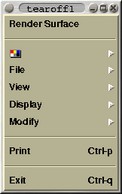
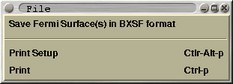
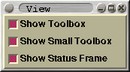
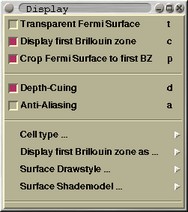
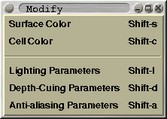
The Fermi surface viewer does not use conventional menus. Instead
it uses the pop-up menu which appears upon right mouse button click
(the other mouse events are described in the
Mouse events for display window
section). The pop-up menu together with its five cascades look
like:
 |
 |
 |
| Popup
menu |
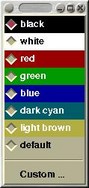
Palette cascade |
File cascade |
 |
 |
 |
| View cascade |
Display cascade |
Modify cascade |
- Rotation: press-and-hold left mouse
button and move the pointer
- Zoom (+): press-and-hold Shift + Left mouse
button and move the pointer up
- Zoom (-): press-and-hold Shift + Left mouse
button and move the pointer down
- Pop-up menu: press-and-hold the right mouse
button

![[Figure]](img/xcrysden-picture-small-new.jpg)